Showing posts with label Data. Show all posts

Sunday, May 19, 2013

Taking Another Look at SQL

The man; the mystery
Many people think they can do without RDBMS's.  But before you say goodbye to the relation forever, I think it's useful to recall the problem for which it was meant to solve.  We've become so used to RDBMS's that their benefits may too close to us to be seen clearly.  I have a new-found appreciation for them after reading Ted Codd's 1981 Turing lecture.

Recall that prior to RDBMS's were DBMS's.  If you had data that you needed to persist, you had two options: file-based storage or hierarchical databases like IBM's IMS.  In either case, data storage code was highly coupled with application code.  If you wanted to add a new field to your customer information in IMS, for example, you had to update all your pointers referencing customer information.  If you wanted to query your data, you had to bake your searches in from the beginning.

One of the main things RDBMS's provided was an abstraction layer between your application code and your data model (your data structures, operators, and integrity rules).  Want to add a new persisted field?  No problem!  Programmers could be more productive by focusing on business logic rather than storage details.


Still, by using a relational data model, RDBMS's do shape application code.  They let you query data in ways you had never planned, but you need to have a system to get your data in and out of them.  Hence the need for ORM.  One of the benefits of NoSQL databases like MongoDB is that they have an incredibly simple key-value-based data model.  You can ignore ORM completely, and thus spend even less time thinking about storage.  (There is a trade-off, of course.  Querying the data becomes more difficult).

If there is a reason to go NoSQL, it's programmer productivity.  NoSQL made a lot of sense for Google in the early 2000's due to the cost of hardware. As the cost of processing power continues to decrease, the need to use commodity hardware should not be a central reason to turn to NoSQL for most people.  Programmer productivity should.

In short, I see the move from DBMS's to RDBMS's and now back to NRDBMS's (non-relational database management systems) as part of a broader trend to abstract away details and work on the interesting stuff.  Just as with garbage-collection in OO languages, we're always looking to get closer to the pure space of thought,

Sunday, May 5, 2013

Data Science and Its Uses

I wanted to put together a collection of interesting articles and studies in the emerging field of data science.  For your enjoyment:

First, what is data science?

McKinsey had a nice report in 2011 on big data.  It predicts we'll need 140,000 to 190,000 additional data scientists by 2018.

Everyone has heard that companies like Facebook and Google make money off your data, but it's hard to know what that means.  This became all-too-clear when the New York Times explained how Target knows you're pregnant.

Nate Silver has predicted the last two presidential elections--the most recent with 100% accuracy.  This seems astounding, though he has claimed, “The bar set by the competition was invitingly low.  Someone could look like a genius simply by doing some fairly basic research.”

Google used search data over the last year to determine flu trends.  However, since their estimates were based on search terms, and the flu was over-hyped by the media, their numbers are a little high.  Still, Google predicted the surge two weeks before the CDC.

Science--now eScience--has also been changed by data analytics.  Check out the Large Synoptic Survey Telescope, which creates 40 TB of data per day.  Jim Gray has called this the Fourth Paradigm for science, after experimental (18th C.), theoretical (19th C.), and computational (20th C.) paradigms.

Data can come from anywhere.  Some analysts are even mining recipes in order to see how flavor compounds vary by region.  What do you do with this information?  In principle, it helps us understand why certain foods pair well together.

Social media sites like Twitter provide a wealth of data about how people are feeling about just about anything.  Tweets can even be used to predict the stock market.

Even the Humanities have gone the way of big data.  Check out this analysis of emotions in 20th c. books.  Perhaps analytics will dethrone critical theory and identity politics. 

No list would be complete without some cautionary tales.  It's not exactly data science, but it's important to recall Knight Capital's faulty trading algorithm, which cost $440 million in seconds.

An many, like Nassim Talib, worry that big data can show correlations between anything.  The more data, the more false positives.  More data isn't always better.  Start small.

If you want to learn more, I recommend Bill Howe's Coursera class.  Make sure you know some Python.

Monday, October 29, 2012

Polyglot Persistance

There's been a lot of breathless optimism surrounding the NoSQL movement, as well as some bashing of the SQL-based RDMBSes that have held dominance for the last 40 years. The very name 'NoSQL' might suggest that there's no need for SQL any longer.

Martin Fowler and Pramod Sadalage provide some much-needed perspective in their new book SQL Distilled. They don't see Oracle or SQL Server going anywhere any time soon. There are three main reasons for this. First, SQL has forty years of production experience. Big banks are not going to jump to Hadoop for their transactional systems. Second, it's easy to find programmers with SQL experience. Not so for NoSQL. Third, and perhaps most importantly, NoSQL and SQL are meant to solve different problems.

Fowler and Sadalage suggest two main reasons for going NoSQL: programmer productivity and data access performance.

Column-oriented and document store NoSQL databases can be more productive for programmers because they can store objects as JSON. There is no need for ORM mapping, which has been called the 'Vietnam of computer science.' Of course, many problem domains require too many or too complex of relationships between objects to allow for this.

The main reason NoSQL databases were created was scaling. Companies like Amazon and Google pioneered NoSQL because they had way too much data to store in SQL databases. Frankly, I don't think very many companies need to worry about scaling to Google size, or they can cross that bridge when they get to it.

One of the things Fowler and Sadalage emphasize is that we don't yet have enough experience to even say when we should choose NoSQL over SQL. Still, they point to a storage architecture that takes advantage of the strengths of all systems. They call this polyglot persistence.


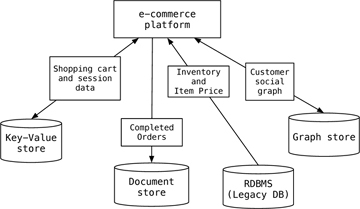
For example, in a eCommerce system, a shopping cart could be served by a key-value store like Riak; the orders and products could be an OLTP database like Oracle; order history could be in a document store like MongoDB; and customer suggestions could be maintained by a graph database like Neo4j. Of course, we could add to this a warehouse using Pentaho or a logging system using a column-family store like Cassandra.

The important thing is to gain familiarity with these products and to do POC's demonstrating the strengths and weaknesses of different approaches. For instance, I like the idea of a polyglot approach, but this puts a lot of pressure on the DBA's. In large organizations, you often have a split between developers, who know what needs to be done, and DBAs, who have the power to do it. Maintaining a number of data stores isn't for the faint of heart.

On that note, I'll be working on putting some MongoDB into practice with Python, Django, and a bunch of other things I don't know anything about. More to follow...

Sunday, September 9, 2012

Mapreduce and Key-Value Systems

I've been playing around with Riak (ree-ack), my first foray into NoSQL, and it's been a lot of fun. Riak is an open source implementation of Amazon's DynamoDB. It's a web-ready key-value store that scales easily. And it's a whole different world from RDBMS's. Basho has a great tutorial for getting started.

If you're a database guy like me, you're probably wondering what you can do with a key-value store. Using key-value tables is a SQL anti-pattern. Even if you get performance and scalability (which I'll discuss in an upcoming post), it's hard to see how you could do any interesting queries with a key-value system.

One thing to note is that a file system is basically a key-value store. The key is the file name and the value is the contents of the file. You can do searches on file systems, but you can't really do much querying. If your data needs are more like a file system than complex analytics, a key-value store might be right for you.

I also finally learned what the MapReduce algorithmic framework does. You may have heard of MapReduce (amongst many other new technologies) in connection with Hadoop. MapReduce will probably go down in history as one of Google's greatest contributions to computer science (along with the PageRank algorithm).

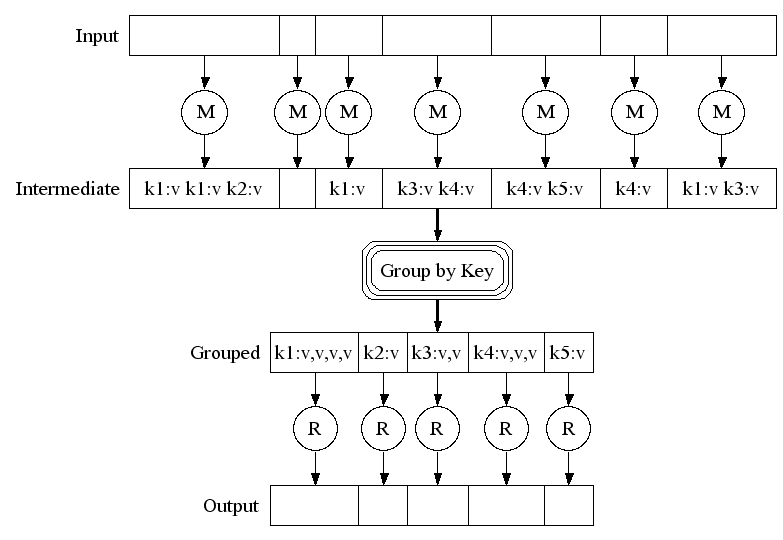
MapReduce is inspired by a functional language, LISP.  The idea is simple: take the algorithm to the data. In a highly distributed and scalable system, it's not feasible to move data to a processor in order to aggregate and slice it. You have to do any processing in-place. The way to do this is to map your keys to some kind of broader category and then run a reduce algorithm over the mapped data to pick out only the information you need.


For example, let's say your key-value store contains documents, and you want to count the number of documents beginning with the letter 'X' that contain the word 'tibialoconcupiscent'.  In this case, you would map all documents with a key like 'x*', such as 'xerophagy.pdf'.  Your reduction algorithm would simply return 1 for every case of the word and 0 otherwise. This reduction could be run on each server, a group of servers, and then all servers, returning a single (probably small) number.

This framework may seem limited, and it is. Key-value systems just aren't great for complex querying. One reason SQL has been so popular is that it allows for unlimited combinations of queries. You're limited in the ways you store data, and you have to wait for the system to write the data to disk in order to ensure consistency, but you can read the data in lots of interesting ways. That's why it's called a Structured Query Language.

(Riak does let you do some more interesting things because you can create links between different keys that define any kind of relationship between them. These links are just metadata. You can MapReduce across links, but the basic idea is the same.)

Now, where would I use Riak? There are a good number of production users already. I would think it would be best used in systems that don't require a lot of complex querying or complex data types. For instance, it could store webpages, messages, or other content. Unless you have a huge amount of data or require very fast writes, it's probably not necessary. But if you're looking to grow fast, it might be the right choice.

Sunday, August 19, 2012

Cathedrals, Bazaars, and Data

According to Eric Raymond, with enough eyeballs, all bugs are shallow. This is the secret to the success of open source software. Linus Torvalds' primary innovation wasn't so much creating Linux as the development model surrounding it: get something out there, get people using it, and have them be your testers / contributors. That is, make users co-owners, not just consumers. Raymond compares open source software development to a bazaar, as opposed to a building a cathedral.

I've been using Linux and open source software for more than a decade, but I've always been a bit wary of open source databases. Do you really want a fail early/often approach when dealing with people's data? Oracle has made a killing off of Data Fear. After all, can you promise 99.999% uptime with an unproven system? Open source might be fine for startups, but is it fit for enterprise?

PostgreSQL seems to merit the hype. Even SQL Server DBAs like it. I don't have experience with it on the enterprise, but I'm impressed so far. I believe that it's a tested solution, and I really like its extensibility. Anyone can create any kind of extension, such as an Amazon Web Services interface or K Nearest Neighbor mapping.

As a .Net/SQL Server developer, however, I have some concerns.

First, is free really free? SQL Server Enterprise is $6,874 per core. Oracle Enterprise is $47,500 (though Standard Edition One is only $5,800). That's nothing to sneeze at. I don't know Oracle that well, but with SQL Server, you get a whole suite of technologies--ETL (SSIS), data warehousing (SSAS), and reporting (SSRS) in particular. You get a number of disaster recovery options, like 2012's AlwaysOn.

By default, PostgreSQL works from the command line. You can download PGAdmin, but Navicat costs money. Graphical ETL tools? I don't think so. Reporting? You'll probably have to spring for Crystal reports. Data Warehousing? I hear Pentaho is a pain. It would be hard to keep PostgreSQL free--at least in an enterprise environment.  If you're just doing CRUD for a web UI, you're probably ok--for a while.

The second thing that makes me nervous is the ridiculous number of open source technologies out there. The principle of open source is to 'let a thousand flowers bloom,' but in practice this means playing around with a whole lot of different products and figuring out how they can fit together. It seems like chaos. Microsoft is known for its Three Letter Acronyms (TLAs), but at least everything fits together pretty well.

Finally, because of the complexity of open source solutions, I can't imagine they'd be easy to maintain. Most companies now outsource common DBA and production support tasks. If you're running a PostgreSQL OLTP system with a MongoDB document store and Hadoop web logging, you'll have trouble getting Tata to maintain that for you. Even if you're not interested in outsourcing, it is useful to have standards and best practices across companies.

Of course, it's the innovative start-ups that are using new open source technologies to do new things.  This is one of the main factors that helps them be innovative. They don't want to be standardized. They want to be part of the bazaar of new tech IPOs, rather than the cathedrals of established companies--at least until they have enough users for the cathedrals to buy them.

Anyway, I'm having a lot of fun.  Check out my new favorite book.

Sunday, July 22, 2012

Describing the World

"In every company, there is invariably the one word or phrase that is critical to the business the company is in.  This in the word that everyone uses.

The problem is that no one can define it. Or rather everyone defines it. There is no single definition.

Don't include that word in your model. Instead, for each of the concepts represented, find a clear term to describe that concept."
--David Hay
Data modeling is hard, it's hard to agree on what exactly it is that needs to be modeled. IT solutions are supposed to mirror the needs of 'the business', but there are lots of different components of a business.

Hay provides an example: In an oil refinery he modeled, the word everyone used--in different ways--was 'stream.' So, instead, he chose 'fluid path', 'material assignment,' and 'movement.'

There's nothing special about oil refineries or any other type of business. Nor is the problem of ambiguity specific to data modelers. But it sure makes our job hard. Coming to a single definition on a term can bring out all the factional politics that you hoped you could avoid by being a technology professional.

One very important way of getting everyone on the same page is defining shared terms, as Hay suggests, and then circulating these terms so that everyone uses them. But it may turn out that different people or groups want to see the same information in multiple ways, or only care about it at different levels of granularity.

It is likely that you will be able to come to agreement, since you all are part of the same business. Still, the world can be described correctly in many ways.  For thousands of years, philosophers have sought to model the essential nature of reality, but they could never agree. Is the world dominated by change or permanence, progress or cycles, one thing or many?


A data model or a metaphysics is a map. Any map will show certain things and not others. It represents only those things we are interested in. If it were truly accurate, it would have to be the same size as the world, as Borges jokes in a short passage. Similarly, all data models have their uses. Make sure it's clear what uses your model serves.

Sunday, May 13, 2012

Object Relations

I recently talked about the architectural problem of mapping objects to databases. A related problem is the behavior of such mappings. Martin Fowler explains, "That behavioral problem is how to get the various objects to load and save themselves to the database." Though the architectural part is not simple (Jeff Atwood calls it the Vietnam of computer science), behavior can be a much more intractable problem.

It's magic
Think about it. If you load a bunch of stuff from the database into memory and then do some work--especially unpredictable work generated by user commands--you have to figure out what to write back to the database. Some things will have changed, and others will not. Some things might have been updated since you last wrote to the database.

The main thing you need is a unit of work, which keeps track of all changes, writes them back to the database, and checks to make sure there are no conflicts when updating. You could, of course, have a 'dirty' flag for each object, and check each one at the end of your unit of work in order what to determine what to write back. But it's often more elegant to create a unit of work object and take care of objects that are new, dirty, or removed. The problem remains of determining the order of write backs.

If you have a lot of overlap between different units of work in a single session, you may want an identity map, which ensures that objects are only loaded once. This way, you can't accidentally modify two different instances of the same information in memory. An identity map could be located in a session object or as a static object in units of work.

Finally, since you may not want to load all objects into memory at the same time, you might consider implementing lazy loading. The idea is that you don't load data until you actually need it. This may defeat the purpose of O/R mapping, if it ends up leading to a lot of separate loads, but it is a natural extension of the identity map.

Now, much hinges on the actual map itself. How do your objects relate to each other and to the database? If your objects simply mirror your database schema, you could use an identity field which stores the primary key for each object / row. If you do this, you'll probably need a foreign key association between objects / tables.

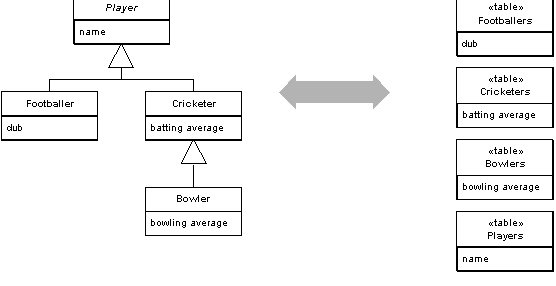
Things become more complicated if you're making use of inheritance. You could have one table to manage an inheritance hierarchy. This is called single table inheritance. This may lead to lots of NULL values in the database table and difficulty in naming things in a single namespace. Another option is to use class table inheritance, in which you have one table for each class. This simplifies the relationship between objects and tables, but it leads to complex joins. You'll also have to be careful about foreign key relationships to other tables, as a primary key cannot be referred to by other tables. A variation on this pattern is what Fowler calls concrete table inheritance, in which you have one table for each level in an inheritance hierarchy. This should help with the foreign key relationships.

An example of class table inheritance

All this would be a lot to implement by hand, which is why Microsoft created the Entity Framework, first introduced in .NET 3.5. Java coders may try Querydsl. I haven't had a ton of experience dealing with OR behavioral issues, but I can understand the appeal of the EF. You can simply build your objects, build the relations, and then export a database from Visual Studio. I worry about the performance of these tools, but they seem flexible enough to allow for customization. Whether or not this customization is worth the development effort required is another question.

Sunday, May 6, 2012

Data Staging

The best image I could find?
In Extract, Transform, & Load ETL processes, you might save the data you are extracting to a temporary location and in an unadulterated state. This is called staging the data. Staging is an interesting word. It's a synonym for scaffolding, or a temporary support for something else, such as a career in cooking, a cancer treatment, or a rocket's trajectory. In this case, data staging is a preparation for data that has the format, structure, and purity you want. A data mart is a stage for a data warehouse.

Staging could seem like a bad idea for a number of reasons. First, you're duplicating data. Duplication is almost always a bad word when it comes to data, but staged data should not be used for anything besides staging and perhaps reporting. Still, it requires space, which can be a precious thing even when space is so cheap.

Second, staged data must be written to disk and then read from before doing the final transformations. You're effectively doubling your disk I/O. If the amount of data is significant, this could be a lot of reads and writes.

Written in 2010, a product of experience
These are real trade-offs, but there are a number of reasons to stage, some of which did not occur to me before reading Microsoft SQL Server 2008 Integration Services: Problem-Design-Solution, an excellent book on SSIS best practices by MVP's Erik Veerman, Jessica Moss, Brian Knight, and Jay Hackney.

  • Data Lineage - When you run into data purity issues in production, the first question your production support team will ask is, "Where did this data come from?" A staging area provides means of tracking the import of data and may allow you to run subsequent transformations in a temporary transaction so that you can identify duplicates, null values, or other data purity issues. You will need to keep data around for enough time for such problems to be identified and addressed.

  • Restartability - Jobs fail. The last thing you want to have happen at 3 AM during a conversion process is a job failure (yes, this has happened to me). A staging area should help you restart the job halfway through, after the necessary corrections have been made. This assumes you run your transformations in a transaction, which you are doing, right?

  • Source Alternative - A staging area can act as a reporting environment when your source system is highly transactional or under significant strain. Just make sure you're not doing any writes to stage.

  • Archive - Stage can also be an archive system, which may be useful if your destination system becomes corrupt and needs to be rebuilt. For instance, a data warehouse updated by incremental loads could be rebuilt by running through all transactions. I haven't run across this in practice, though.

  • Performance - Finally, an ETL process might perform best with staged data. Though SSIS can buffer data flows, databases can often sort and aggregate data faster and with less resource load.

As always, there are no universal solutions to data architecture. Don't stage data just for the sake of staging data. You'll have to weigh the pro's and con's according to your business, technology, QA, and production support needs.

Sunday, April 29, 2012

Where's the Logic Go?

Typically, the business logic resides in the middle, or domain, layer
Every application has at least two components: the design of technology platforms, called the application logic, and the processes that need to happen, called the business logic. In theory, the business logic is dependent of the application logic, since a business has rules, workflows, and transactions that have nothing to do with any programming languages or database systems. In practice, however, application logic can put constraints on business 'illogic.'

One of the key design choices in developing any application is deciding where the business logic should go. Database developers think it should go in the database, since keeping the code at the database level is often most performant. The problem with this is that SQL doesn't have many of the basic niceties of any Object-Oriented language. Furthermore, since stored procedures use proprietary SQL, they can prevent the migration of database code to another vendor.

OO developers think business logic should reside in the domain layer, since objects are best at representing the real world. Libraries and IDE's like Visual Studio make it very easy to get an OO application off the ground, and they help with maintainability. For many applications, however, the amount of code necessary to create an MVC model, for example, is not necessary and may even be prohibitively burdensome.

In reality, no application design should be used for all problems. Martin Fowler provides four models that couple domain and database access logic.

Transaction Script / Row Data Gateway - Domain code simply passes requests from the UI to the database. Database access is modeled at the record level.

Table Module / Table Data Gateway - Domain code is organized in objects corresponding to tables in the database. Database access is modeled at the table level.

Domain Model / Active Record - Domain code is organized according to business rules. Database access is modeled by CRUD objects.

Domain Model / Data Mapper - Domain code is organized according to business rules. Database access is modeled by a mapping object layer.

Fowler suggests that your choice of pairings should depend upon the complexity of your business logic. An application used for reporting can simply send requests to a database, but a complex sales order process should probably be mirrored by a domain model and a data mapper. A domain model will have a higher up-front cost, but it may pay off as the complexity of an application increases.

I think this general trade-off makes a lot of sense, and it helps me understand and categorize a number of applications I've seen. But, unless I am mistaken, pretty much any enterprise application is going to require a layer for business logic objects, a layer for data mapping, a layer for data access, a layer for the data itself, and, of course, the presentation layer. If it's possible to reduce the complexity of these layers, do so!

Sunday, March 25, 2012

Is Statistics the Key to the Soul?

I've been brushing up on my statistics, since I was convinced I didn't learn anything practical in my two semesters of calculus-based 'statistics.' It turns out that I did learn a thing or two besides how to integrate Poisson distributions. What struck me most about statistics this time around is its objective power. I'm coming to believe that the history of human progress is the history of increasing abstraction--from markets, which abstract price from use value; to language, which substitutes abstract signs for the world's infinitude; to representative governments, which generate the will of the people from voter preferences; to information theory, which abstracts universally-understood 0's and 1's from meaning. Each new power of abstraction provides a new tool for humans to shape the world.

Borges' library has been found!
Of course, abstraction has its price. There's always something lost in the process of abstraction. Jorge Luis Borges (the author of the story for which this blog is named) writes at length about the experience of hitting the limits of abstraction, the real world. For example, if all knowledge was written down, we could never know anything, since we'd spend all our time sifting through an infinite number of books contained in an infinitely-forking library. If we remembered every experience we had in its minute detail, we'd never be able to live in the present or learn from the past. Similarly, the will of the minority loses out to the will of the majority, and statistics can never replicate lived experience.

Processes of abstraction can also be fetishized for their own sake. The operations of markets, the intricacies of language, the back-and-forth of the political process, the elegance of algorithms, or the endless march of statistical analyses are all deep, deep rabbit holes from which many never return. There's a point at which every student of philosophy--having been convinced by philosopher after philosopher--decides that it impossible to determine who is right and resolves, if only for a short time, to study philosophy solely for the beauty of its systems. There's even a perverse pleasure in the counter-intuitive nature of abstract thought, such as learning that rent control makes rent higher or that work = 0 when something is moved a great distance before returning to its origin.

One of the most interesting characteristics of processes of abstraction are the ambiguities inherent in them. Since abstractions miss something real, they are always equivocations. This happens in language when we can't decide what to call something. Is Pluto a planet or an asteroid? In statistics, ambiguity appears in the form of studies that contradict each other. Are eggs good for you or not, for chrissake? Statistical analyses are objective and help us overcome the biases of our thought processes, such as when they show us the irrationality of our fear of flying, sharks, and home invasion. But it's easy to slice the world into irreconcilable parts when those parts are so small in comparison to the actual, ever-changing world. Scientists often can't reproduce the results of their experiments. This means that either 1) the laws or regularities of the world are not the same now as they were at the time of the experiment or 2) there is some variable which they have not accounted for. And there are always variables that are not accounted for.

With the growing trend of personal data collection, from activity tracking to sleep monitoring to mental acuity quantification, we will soon be able to analyze ourselves with ever greater scrutiny. If you want to know exactly how far you've run in the last five years, you can do that. Does this make you a better runner? That is not clear, but the trend is. We'll soon be able to use the data mining techniques that advertisers like Google created on ourselves. In some ways, this is exciting. What better way to know thyself than with objective data? Conquering ourselves may be the next frontier of the powers of abstraction. But this path will be fraught with even greater dangers of experience lost, fetishization, and ambiguity.

Sunday, January 15, 2012

The Visual Display of Quantitative Information

What is to be sought in designs for the display of information is the clear portrayal of complexity. Not the complication of the simple; rather the task of the designer is to give visual access to the subtle and the difficult--that is, the revelation of the complex.
--Edward Tufte
If you're serious about data, you should be serious about charts.

Like many IT professionals, I once scoffed at charts and reports. These were for polluting PowerPoint presentations, cluttering inboxes, or bringing an end to too many trees. I certainly never wanted to be a reports writer, the lowliest of all data professionals.

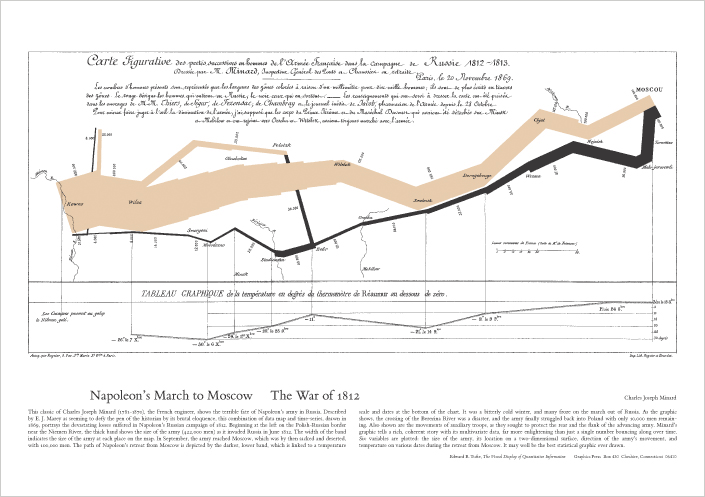
 But if a picture is worth a thousand words, a good data graphic is worth tens of thousands of data points. It displays the relationships between numbers in a manifest way. It reveals causality and correlation. It shows at a glance the reasons behind the numbers.

6 kinds of data in one image = Joy

 I've had users cry with joy at the sight of a chart. This is often hard for us IT professionals to appreciate, since we secure, transform, and display data, but often don't really understand what the numbers mean. It's also hard to appreciate the power of a chart when you can write a query to get whatever you want.

But I think the main problem with taking data graphics seriously is that they are so frequently abused. They display small and unrepresentative data sets, using more ink (or pixels) than words would need. They are cluttered and sensational, meant to grab the eye rather than convey information. They are meant to supplement a lack of data rather than complement an overabundance of it.

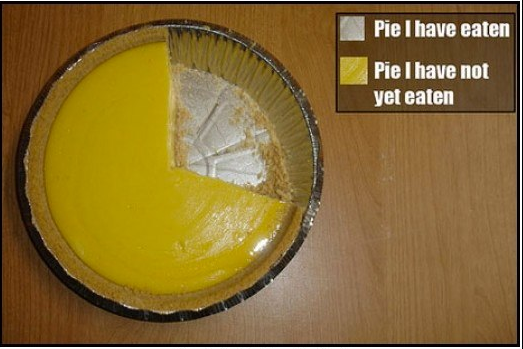
Perhaps the only good pie chart
A data graphic should assume that its viewer cares about the information it reveals. Any principles that could be outlined are secondary to this maxim, but I'll note a couple here.
-Use only as many graphical dimensions as you have dimensions of data. For example, do not use 3D graphics to show pure quantities
-Erase or omit any graphics that do not show the data
-Make your grids and axes show data points, not arbitrary periods

Admittedly, the architects of the charting software you'd use to create data graphics have absorbed Tufte's ideas. I have not seen too many Excel charts that made me weep. But it's worth studying the history of data graphics, comparing good and bad graphics, and trying to understand the difference between the two.

Links:
-Tufte's seminal book
-Jeremiah Peschka's suggestions for letting the users make their own reports
-DataVis's gallery of charts, good and bad

Sunday, November 20, 2011

Database Version Control Goals

I'm currently version controlling a database and developing version control processes which will be used by a new team at my company. Everyone knows you should version control your database, but what exactly this means and how to go about doing it are not obvious. As I've mentioned before, version controlling databases is much different from version controlling application code, because you can never start from scratch with a database.

To meet the minimum requirements of a version control system (VCS), you must be able to:
  1. Maintain a directory structure of all database objects
  2. Maintain change/upgrade scripts
  3. Isolate development from production code
The most basic version of Subversion will allow you accomplish these tasks, with two caveats. First, you have to either build your directory structure from the ground up, or you have to form some kind of process that will script out your database. I've tried the latter with Powershell, SSMS, Visual Studio database projects, and custom .Net code using SMO. In my opinion, the least bad option is .Net, since the code is not too difficult to write and you can customize it to your needs. You can add in functionality to script out only objects changed after a certain date. However SMO is incredibly slow. It took me 2 hours to create a baseline for my database.

The challenge shared by all of these home-brewed approaches for scripting out database objects is that you have to be consistent. For instance, if sometimes you use SSMS and sometimes Powershell, the object scripts may be slightly different and create false positives in your VCS.

If you stick with these minimum goals, you are also hampered by the annoying and uncertain process of having to maintain change scripts on top of your object scripts. I'm sure you always test your change scripts thoroughly on test environments that exactly mirror production, but you can never be 100% sure that your codebase actually matches your production database. Finally, if you want to create sandbox environments, you'll have to create another process for turning your object scripts into database generation scripts. This is more important if you work at a software company and need to be able to reproduce defects in old, supported code than if you work in an in-house database system. In either case, it's still a good idea to be able to create sandboxes for developers so that people don't break each other's code from working in the same database.

For these reasons, you also want to be able to:
  1. Generate change scripts automatically
  2. Create database environments with test data at any version
  3. Know what version a database is
Now we're talking about incurring some monetary costs, but most likely ones that will pay for themselves. The two main options for achieving these advanced goals are Red Gate tools and Visual Studio Ultimate / Database Edition.

Visual Studio database projects are a cool idea, since you can populate object scripts and compare them against your database, as long as you have something better than VS Premium. You can get Anhk SVN or Visual SVN to version control directly in VS. VS has an 'offline' development model, meaning that you do your code in VS and then later create change scripts by 'compiling' your database. I've had issues with circular dependencies among databases, making this an unfeasible process. You get what you pay for with Red Gate tools, and you'll really want both Source Control and SQL Compare. Source Control just helps you deal with the basic goals in an elegant way, but, when paired with SQL Compare, it will allow you to create scripts to turn any database at any version and turn it into one of any other version. You can also get tools like Data Compare to sync your test and production environments, and you can use the Data Generator to create non-sensitive test data. These features improve the development process, but are not necessarily within the scope of version control.

There are a few options for knowing what version a database is on. SQL Compare will allow you to compare the database with a version in a repository. You could also create a table that stores the database version, which is useful but will never provide 100% certainty about all the objects. Finally, you can create extended events for database objects but Phil Factor doesn't recommend it in the eBook, since there are not many options for documentation. Database version control is slowly making it's way out of the Dark Ages and into the modern, Agile world that other developers have long taken for granted. Once you are able to handle all of the advanced goals, you can do even more things, such as automate the build process and run automated test scripts, a process called Continuous Integration. I must admit that the developments like those Red Gate has made take some of the mystery and the fun away from good ole database development. But I'll probably get over it.

Links:
-Grant Fritchey's article on Simple Talk, which is chapter 3 in the Red Gate eBook
-Michael Baylon's own list of goals and solutions
-Another good article

Saturday, August 27, 2011

The Data Revolution

If you haven't read McKinsey Global Institute's report on Big Data (or at least the executive summary), let me try to convey how important a role data will play in the coming years. Every application has to make use of data, and many industries have built up a lot of data over the last few decades. The amount of data stored is expected to continue to grow at an astonishing 50% per year as storage space becomes cheaper and as our ability to access it becomes easier with cloud technologies. Growth rates are predicted to be 20% for structured data (databases) and 60% for unstructured data (documents, messages, pictures, videos). Our ability to store, architect, and analyze data will impact every major industry, not just Wall Street. Consider a few examples.

TaKaDu, an Israeli tech firm has used data that already exists to better predict leaks in water mains, as well as diversions of the water supply. No new sensors are needed--just better analysis of the data at hand. As water struggles become more intense over the coming years, more efficient use of water is key.

The legal world is being changed through artificial intelligence and data mining as well. Blackstone specializes in e-discovery and provides a cheap alternative to expensive law firms and their armies of 1st and 2nd year lawyers. Why pay people to look at thousands of documents when computers can scan millions?

One of the reasons Tesco has dominated the British groceries market is its ability to understand its customers. It does this through collecting information about purchases and then providing price adjustments and customized discounts. Individual stores are tailored according to the demographics of their customers.

Another interesting example involves policing. As funding is cut, police need to be more intelligent about where they patrol. Smart Policing helps police analyze trends to predict where crime will occur in the future, so less time is needed on the beat.

The data revolution will impact health-care, government, marketing, education--you name it. And, of course, all businesses are working internally to deal with the data deluge. Coworkers need need to be able to share documents in a way that is productive. Products like SharePoint and MarkLogic have become increasingly popular to deal with such unstructured data.

The exponential increase in data and the need to wrangle it will be so great that we will struggle to cope for years. MGI predicts that by 2018 there will be a shortage of 140,000 data professionals in the US alone. It's not just DBAs and architects, but philosophers, analysts, miners, mavens, and entrepreneurs that are needed. One reason that Google and Facebook have become so popular is that they help filter out the noise. I don't pretend to know where this is all going, but I can say I'm excited to be a part of the revolution.
Related Posts Plugin for WordPress, Blogger...